
Calculations follow commonly used HSE practices. Always confirm with your organization’s definitions and local regulations. References: OSHA 1904, ISO 45001, ILO OSH.
Report Details
Manpower Summary (Min / Max / Avg)
| Trade / Category | Minimum | Maximum | Average | |
|---|---|---|---|---|
Key Work Activities (Weekly)
| Activity Description | Location | Status / Remarks | |
|---|---|---|---|
Permits Issued (Weekly Summary)
| Type of Permit | Total Issued | Major Locations / Remarks | |
|---|---|---|---|
Safety Observations / Findings
| Unsafe Act / Condition | Corrective Action | Status | |
|---|---|---|---|
Incidents / Near Misses
| Date | Type | Description | Root Cause | Action Taken | |
|---|---|---|---|---|---|
Safety Training & Toolbox Talks
| Date | Topic | Conducted By | Participants | Remarks | |
|---|---|---|---|---|---|
Housekeeping & Welfare
Highlights & Improvements (This Week)
Challenges & Pending Issues
Summary
📊 Weekly Safety Report Generator – Complete Guide
In every workplace, safety is not just a daily responsibility—it’s a weekly performance indicator. While daily reports capture immediate hazards, the Weekly Safety Report summarizes trends, inspections, incidents, and actions across multiple days, providing a strategic overview for managers and safety officers.
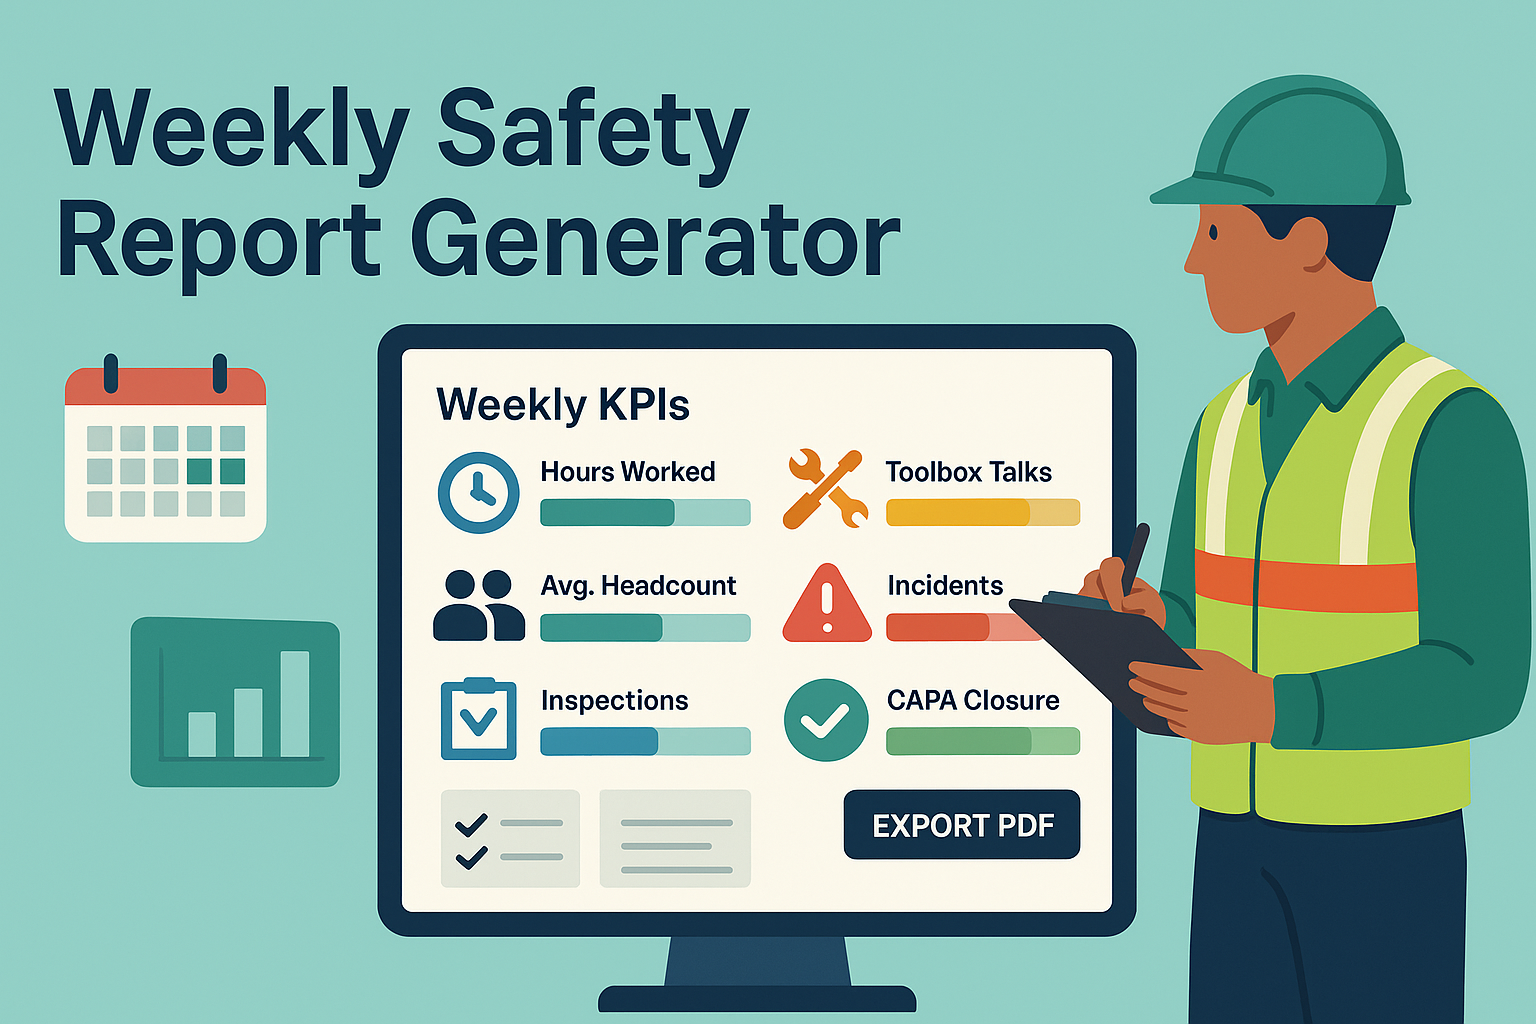
With this, supervisors can track KPIs (hours, headcount, toolbox talks, inspections, incidents, CAPA progress) and plan for continuous improvement. It also provides documented proof of compliance with OSHA, ISO 45001, ILO standards, and local HSE regulations.
✅ What Is a Weekly Safety Report?
A Weekly Safety Report consolidates all safety activities and performance data from the week into one structured summary.
It typically includes:
- Work duration: Total hours worked and average headcount.
- Engagement: Toolbox talks (TBT) conducted.
- Oversight: Inspections completed and their findings.
- Performance: Incidents, near misses, and CAPA closure status.
- Planning: Highlights achieved and next week’s action plan.
⚠️ Note: Weekly reports are trend-focused, complementing daily reports and Job Safety Analysis (JSA).
📋 Key Components of a Weekly Safety Report
- Timeframe → Week start and end dates.
- KPIs → Total hours worked, average headcount, toolbox talks, inspections.
- Findings & CAPA → Progress on corrective and preventive actions.
- Incidents & Near Misses → Brief summaries (e.g., FA, MTI, LTI, NM).
- Highlights & Plans → Achievements and upcoming initiatives (e.g., drills, audits).
- Trends / Charts → Coverage metrics (e.g., ≥1 TBT per day, ≥2 inspections per day).
- Footer & Compliance Note → Record-keeping and audit trail.
🛠 How to Use the Weekly Safety Report Generator
- Enter the Week Range → Select start and end dates.
- Fill in KPIs → Hours, headcount, toolbox talks, inspections.
- Summarize Safety Performance → CAPA, incidents, highlights.
- Preview Live Dashboard → Check KPI tiles and progress bars.
- Download PDF → Export as an A4-formatted, print-ready report.
- File Records → Maintain for compliance and management review.
💡 Pro Tip: Use the built-in bar graphs to compare actual vs. target coverage (e.g., ≥1 TBT/day, ≥2 inspections/day).
📊 Example Usage
Example 1 – Construction Site
- Hours: 5,600 | Avg. Headcount: 180
- 24 TBTs (met target), 18 inspections (below target).
👉 Action: Focus on more scaffold inspections next week.
Example 2 – Factory
- CAPA findings: 12 (8 closed, 4 pending).
- Incident: 1 FA case (finger cut), 0 LTI, 2 near misses.
👉 Action: Toolbox talk on guarding; replace damaged hoses.
Example 3 – Office / Corporate
- 0 incidents, strong housekeeping compliance.
- Next week: Fire drill + AED awareness training.
📌 Why Is a Weekly Safety Report Important?
✔ Tracks safety performance trends.
✔ Provides data for management decisions.
✔ Ensures legal and standards compliance.
✔ Identifies gaps in inspections and CAPA follow-up.
✔ Enhances the overall safety culture.
🏢 Real-World Applications
- Construction Projects → Track weekly site safety.
- Factories & Plants → Monitor inspections, incidents, CAPA closure.
- Corporate Offices → Review emergency drills and welfare safety.
- Oil & Gas → Ensure weekly safety briefings and compliance audits.
🔍 Common Mistakes in Weekly Safety Reports
❌ Treating weekly reports as just “paperwork.”
❌ Failing to compare performance against targets.
❌ Missing CAPA closure progress tracking.
❌ Reporting only incidents, not near misses or hazards.
📌 Best Practices for Weekly Safety Reporting
✔ Define clear KPI targets (e.g., ≥1 TBT/day).
✔ Compare actual vs. target performance (progress bars help).
✔ Include trends and CAPA updates, not just numbers.
✔ Use digital tools with auto-PDF export for consistency.
✔ Share reports with management and workforce.
❓ Frequently Asked Questions (FAQ)
Q1: Who prepares the weekly safety report?
→ Safety officers, site supervisors, or HSE managers.
Q2: What is the ideal length of a report?
→ 1–2 pages with KPIs, incidents, and CAPA progress.
Q3: Can charts/visuals be included?
→ Yes, digital tools (like this generator) include progress bars.
Q4: Is it mandatory for all workplaces?
→ High-risk industries (construction, oil & gas) require it; offices may adapt simplified formats.
🎯 Final Thoughts
A Weekly Safety Report bridges the gap between daily updates and monthly management reviews. It highlights trends, performance, and compliance, ensuring accountability and continuous improvement.
By using our Weekly Safety Report Generator, you can:
✔ Input weekly data in minutes.
✔ Visualize coverage metrics instantly.
✔ Export audit-ready PDF reports.
✔ Improve transparency and safety culture.
💡 Pro Tip: Always integrate weekly reports with Daily Safety Reports, JSA, and CAPA trackers for a complete safety framework.
👉 [Explore All Tools Here]
👉 [Open HIRA Generator]
👉 [Open JSA Generator]